Glycemic Index Measurement
How To Measure The GI Of A Food Item
The glycemic index of a food item is measured by scientists in controlled experiments using a sample of subjects.
Volunteers subjects are used to test the effect of a foods carbohydrates on blood glucose levels.
Blood samples are normally taken from 8-10 volunteers. The volunteers are given 25 or 50 grams of carbohydrate in the food being tested. Blood samples are then taken at specific time intervals.
During the 1st hour, blood samples are taken every 15 minutes, and for the 2nd and 3rd hours, every 30mins.
The blood glucose levels from each sample are then measured and their values plotted.
The test food response is then compared to the reference food response.
Glucose is normally the reference food and has a GI of 100 as it is absorbed very quickly. Glucose gives a sharp rise in blood glucose levels.
The glycemic index (GI) of the test food is then calculated by taking the average GI of the volunteers.
The blood glucose level data for each food item can be shown on a graph to represent the effect of the food on blood glucose.
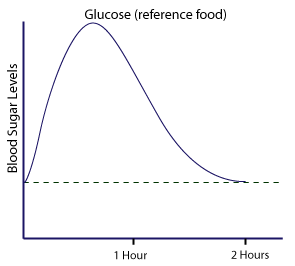
Graph Showing The Effect Of Glucose (reference food) On Blood Glucose Level

The graph above clearly shows a sharp rise in blood glucose levels when subjects are given glucose.
Within approximately 45 minutes blood sugar levels are at a maximum for this food item.
After this peak, levels fall dramatically, almost as quickly as they rose. Within 2 hours blood glucose levels are back down to what they were pre consumption.
This sharp rise and fall helps illustrate the 'sugar rush'; the short lasting 'high' people may feel when they consume high GI foods like sweets and confectionary.
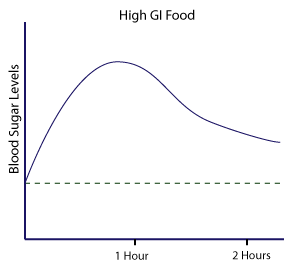
Graph Showing The Effect Of A High GI Food On Blood Glucose Level

With similarities to the curve of the glucose (reference food) graph above, high GI foods also produce fast increases in blood glucose levels.
However blood glucose levels do not become quite as high as the reference food and maximum blood glucose levels are reached after 45 minutes.
Rate of increase and decrease and overall maximum glucose levels will vary between different high GI foods. In this example the high GI food does not reach preconsumption baseline blood glucose levels after two hours.
After two hours blood glucose levels are still about one third of the maximum blood glucose level response this food item produced.
Graph Showing The Effect Of A Low GI Food On Blood Glucose Level

This graph shows the effect of a low GI food on blood glucose levels.
Compared to reference levels (see glucose (reference food) graph above) maximum blood glucose level occurs an hour or so after consumption.
Blood glucose levels gradually rise and fall. After 2 hours blood glucose levels are still higher than pre consumption levels.
Unprocessed oats are an example of a low GI food item which would produce such a response.
Described sometimes as 'slow burning' oats can provide sustained energy levels for a significant time after consumption.